
An official website of the United States government
An official website of the United States government
The .gov means it's official.
Federal government websites often end in .gov or .mil. Before sharing sensitive information,
make sure you're on a federal government site.
The site is secure.
The
https:// ensures that you are connecting to the official website and that any
information you provide is encrypted and transmitted securely.
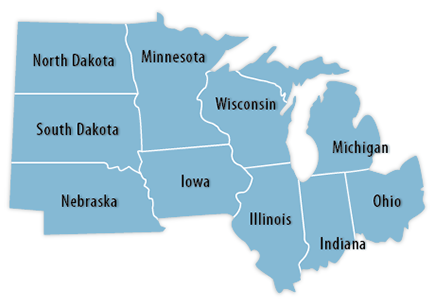
Click a state from the map or pick a state from the list:
Illinois | Indiana | Iowa | Michigan | Minnesota | Nebraska | North Dakota | Ohio | South Dakota | Wisconsin
 Economic Summaries:
Economic Summaries are specialized products that combine data graphically from subjects such as unemployment, inflation, and wages into a single document for selected metropolitan areas. To view a specific area in this region, use the dropdown list below or click here.
Total compensation costs for private industry workers increased 4.3 percent in the Chicago-Naperville, IL-IN-WI Combined Statistical Area (CSA) for the year ended March 2024.
Total compensation costs for private industry workers increased 3.4 percent in the Detroit-Warren-Ann Arbor, MI Combined Statistical Area (CSA) for the year ended March 2024.
Total compensation costs for private industry workers increased 3.8 percent in the Minneapolis-St. Paul, MN-WI Combined Statistical Area (CSA) for the year ended March 2024.
Total nonfarm employment for the Detroit-Warren-Dearborn, MI, metropolitan area stood at 2,018,000 in March 2024 compared to 2,017,800 a year ago.
Illinois had 386,000 job openings in February 2024, compared to 367,000 openings in January, the U.S. Bureau of Labor Statistics reported today.